When we talk about the “well-being” of a population, what are useful indicators to paint a picture of how we’re doing? At the least, we’d say food insecurity, poverty, and infant mortality are vital measures of health and prosperity. How do those align when compared to labor policies?
Each year around Labor Day, Oxfam releases its annual edition of the Best and Worst States to Work Index (BSWI), which measures data points around labor laws and policies in all 50 states, plus DC and Puerto Rico. The foundational principle of the BSWI is the belief that when states have robust supports and protections for workers, working families do better across the board.
But–do we have any proof of that? In the effort to find out more, our research team ran a series of correlations, to compare the way states rank in the BSWI against the way states perform on three vital measures of well-being: food insecurity, infant mortality, and rates of poverty.
How do we measure labor laws and policies?
The policies in the BSWI fall into three dimensions: wages, worker protections, and rights to organize. The more robust the laws, one can assume, the better the situation for workers: a higher minimum wage establishes a higher wage floor and pushes up wages overall; more substantial protections in the workplace (e.g., paid leave, accommodations for pregnant and breastfeeding workers, better scheduling practices) give people more control over their lives; and rights to organize and bargain collectively mean that workers are more willing and able to unify and push for better conditions and compensation.
Within each dimension, every state* is awarded a point (or partial point) for a positive policy, a score which we normalize on a scale of 0 to 100; the overall state scores range from 86.72 for Oregon to 4.55 for North Carolina. In other words, Oregon has most of the policies we track, and North Carolina has almost none.
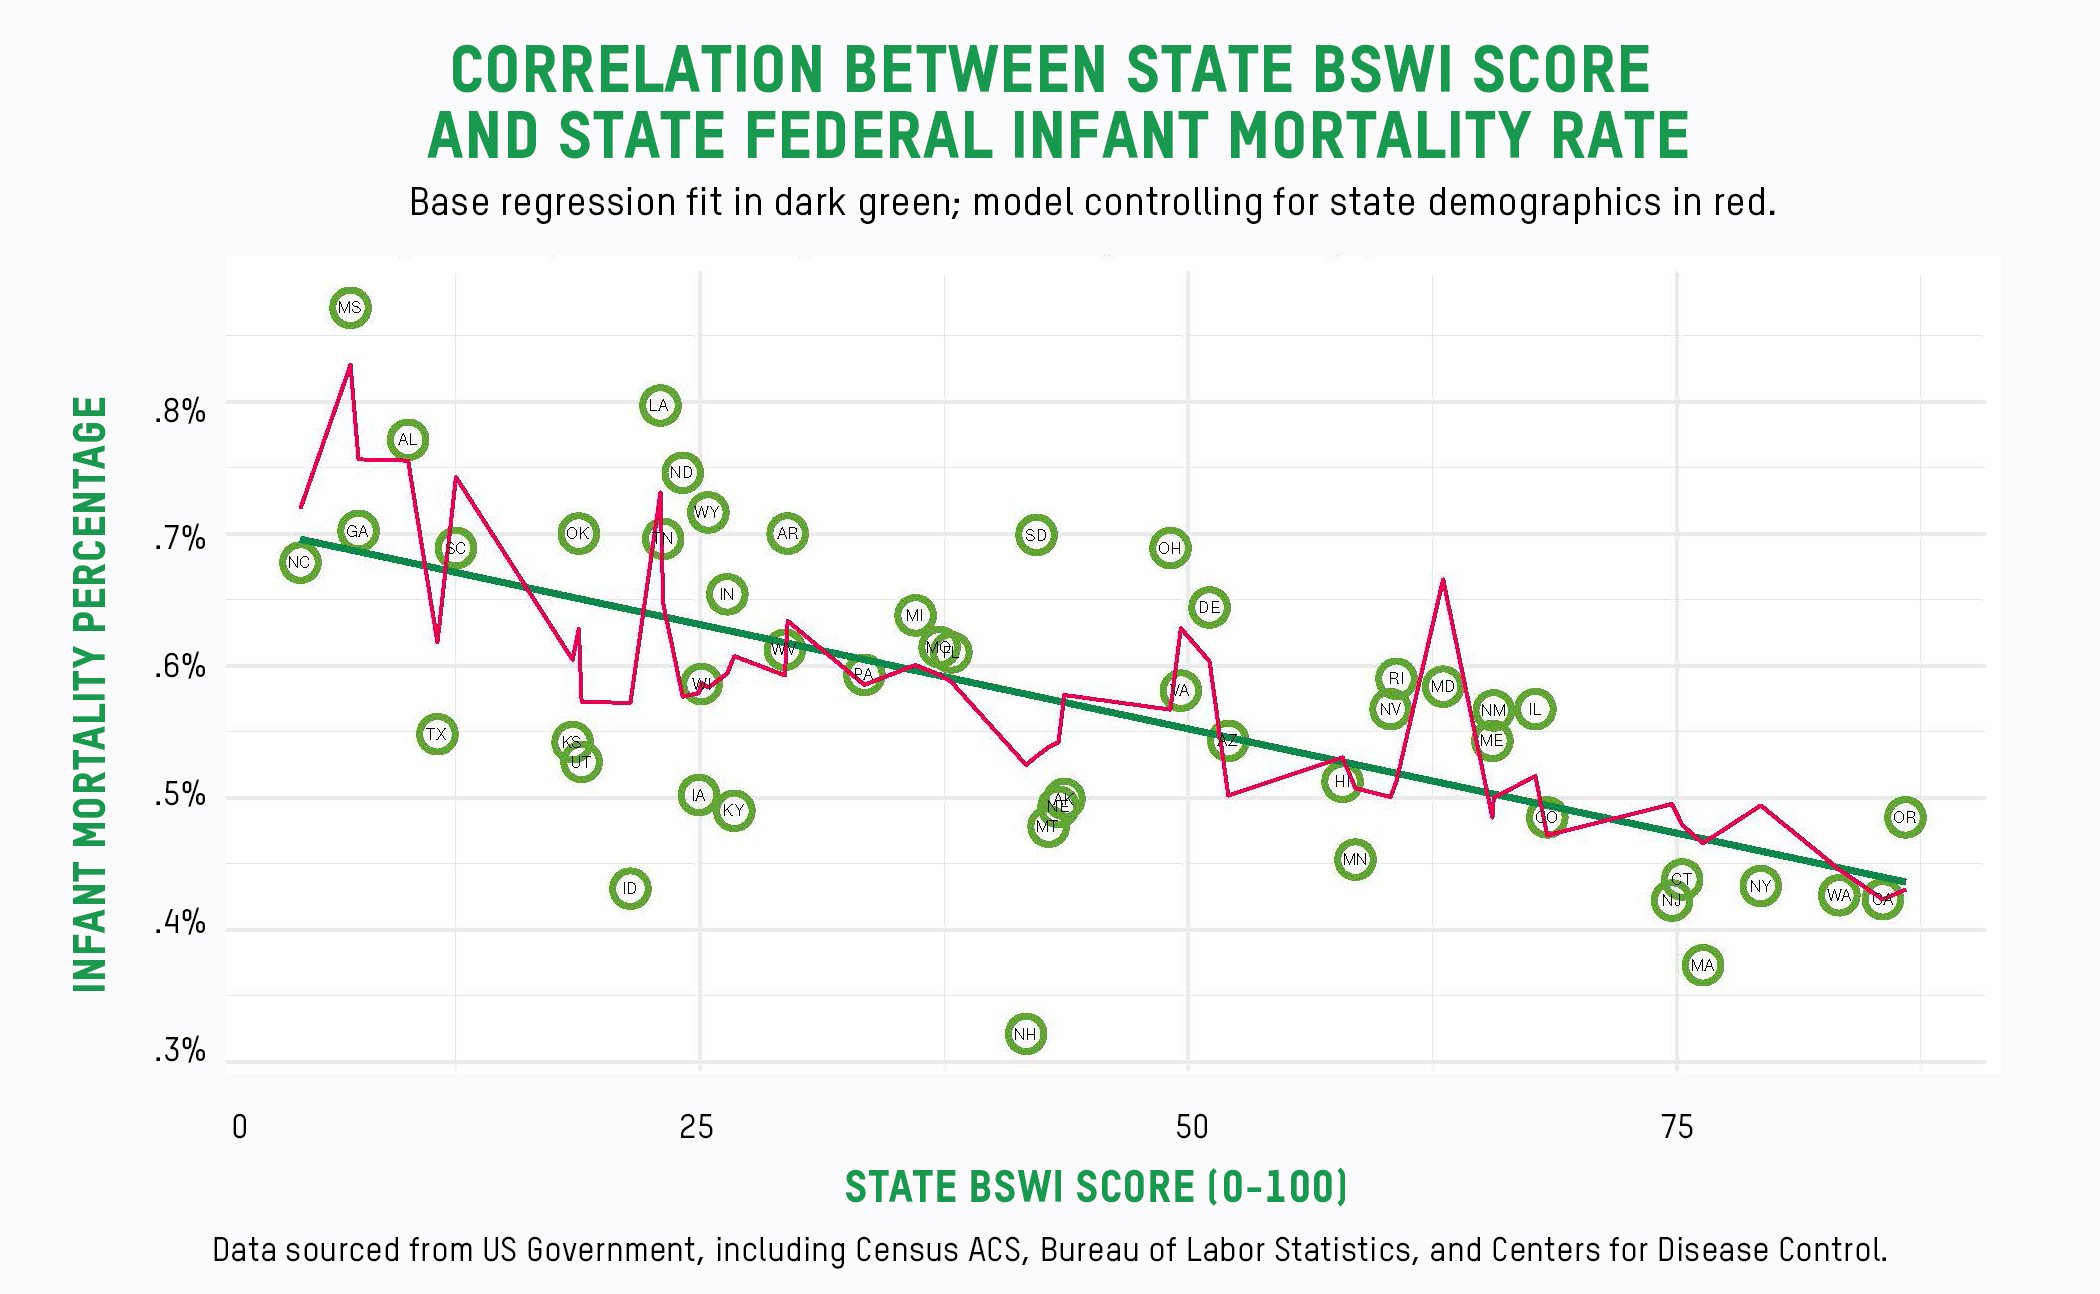
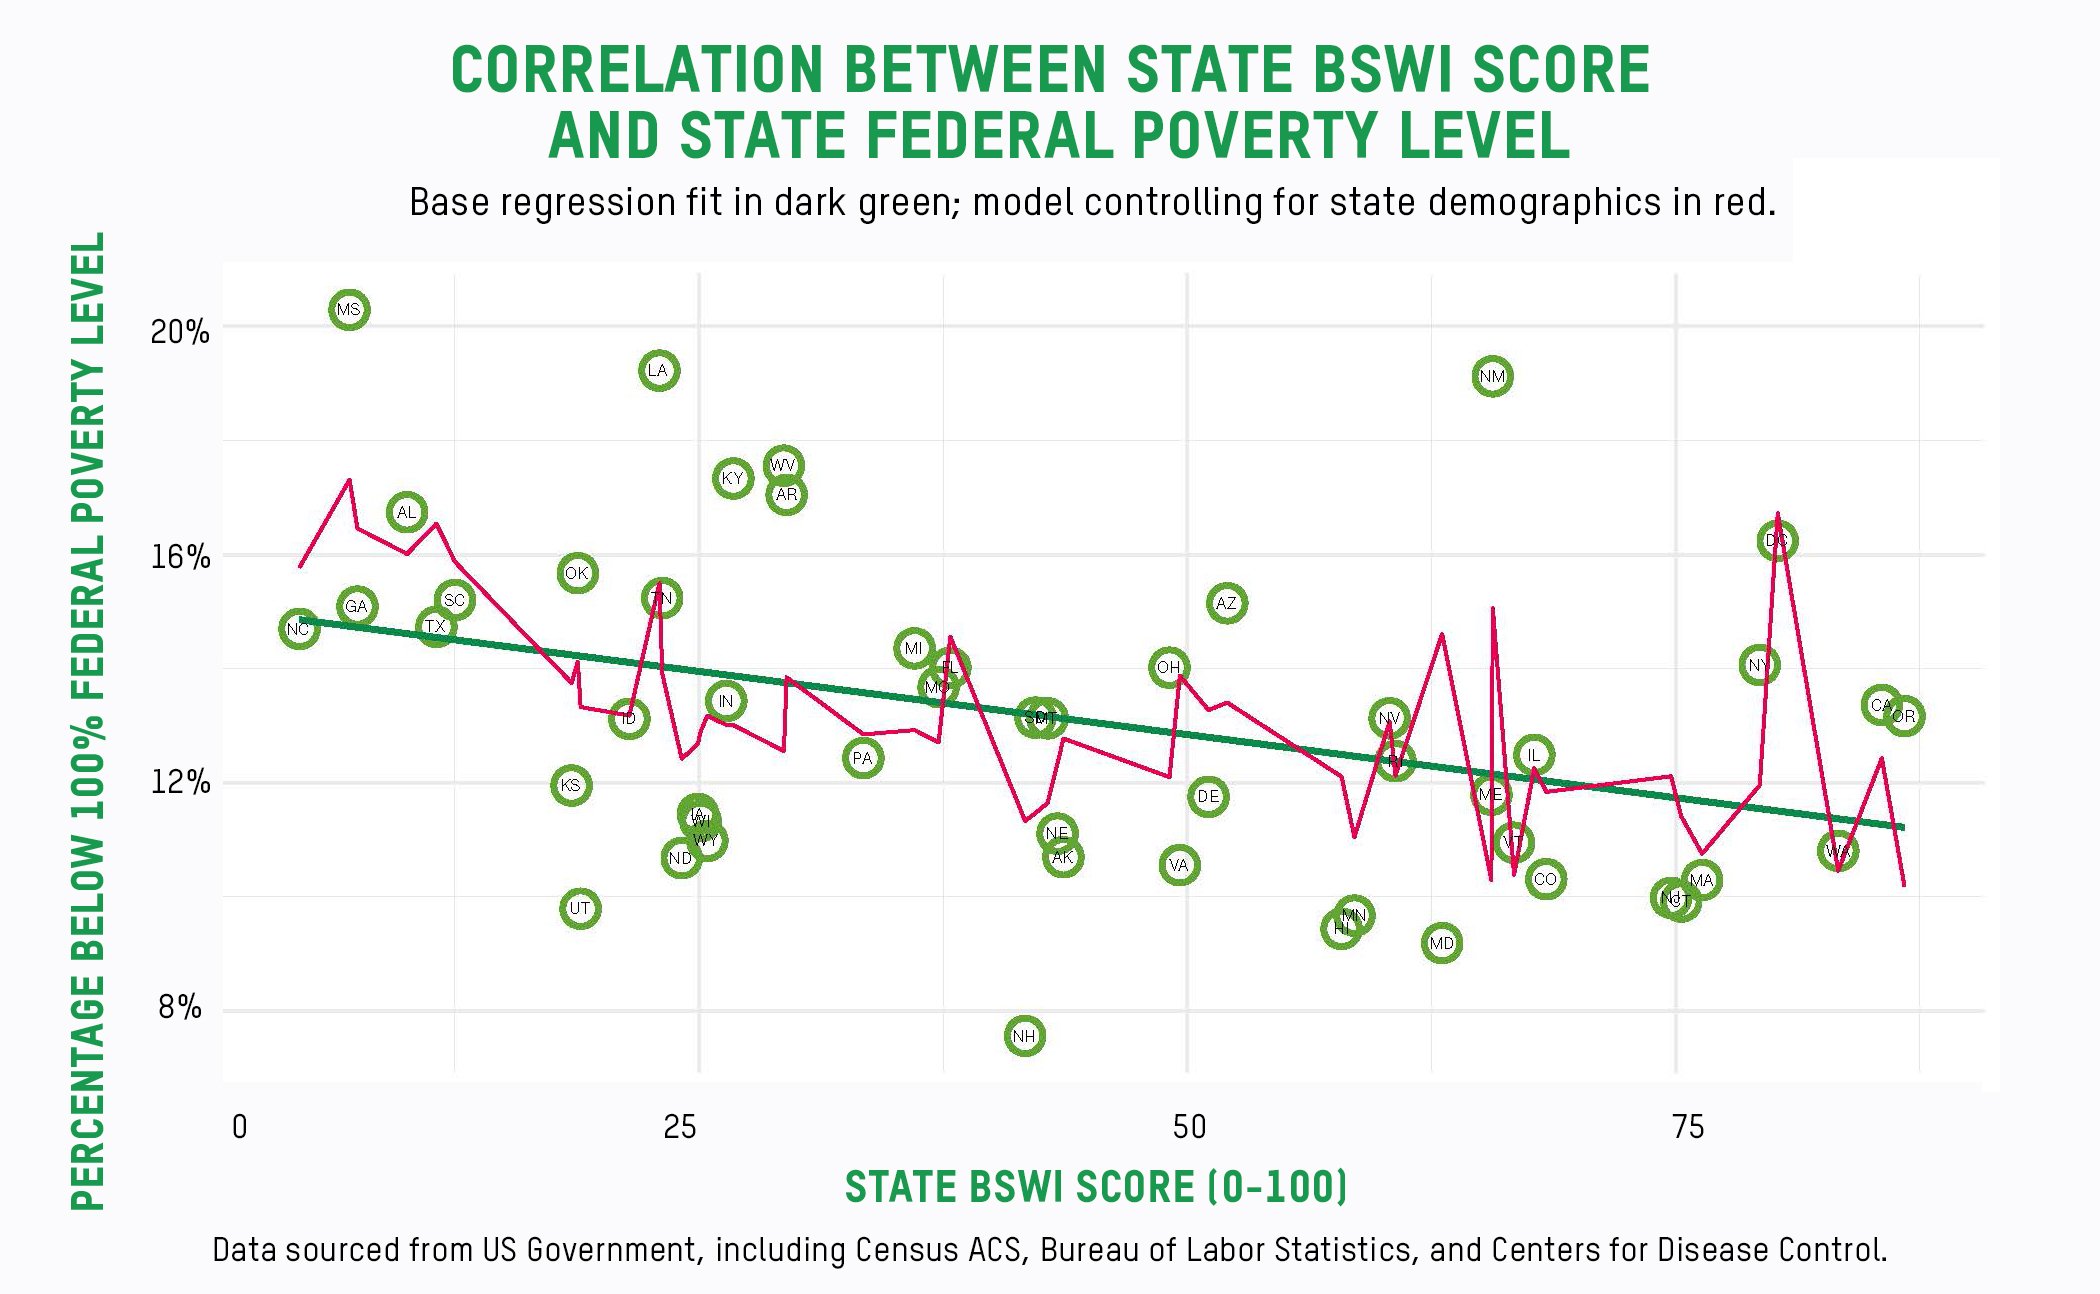
We took these scores and compared them to how states did on our three measures of well-being. Not surprisingly, states that have robust labor laws also have lower rates of food insecurity, infant mortality, and poverty. In other words, doing well for workers translates into doing well for the population as a whole.
Running the numbers
Our findings tell us the policies in our index–focused on wages, worker protections, and rights to organize–contribute to lessening poverty, food insecurity, infant mortality. We found that for every 10-point increase in BSWI score: a state’s federal poverty level dropped by .4 percentage points; a state’s percent of population experiencing food insecurity dropped by .4 percentage points; and a state’s rate of infant mortality dropped .3 percentage points.
Let’s put that into perspective. North Carolina has a rounded score of 5, while Oregon has a rounded score of 87. North Carolina would have to experience a 10-point increase 8 times over just to score in the same range as Oregon. Score matters tremendously; remember, it’s the numeric representation of the number of policies geared towards supporting working families.
The 80 point increase would mean that almost 25% less of North Carolina’s population would be living in poverty, nearly 25% less would be experiencing food insecurity, and the rate of infant mortality would drop 35%. In other words, if the labor policies were changed, nearly a quarter of the current population would no longer be living in poverty. It’s as simple as that.
Low-wage workers are hit the hardest when states fail to pass or implement the kind of policies within the BSWI. Working families earning poverty wages don’t have the financial cushion necessary to be able to leave terrible conditions, take a break when ill, or even look for other jobs. They have no choice but to endure low wages and harsh working conditions in order to provide for themselves and their families.
States shouldn’t enable employers take advantage of that necessity; they should do the bare minimum of mandating hospitable working environments for all public and private employees. Regardless of political affiliation, everyone should be able to see that these policies are meant to ensure citizens have their needs beings met, no matter their class, race, or gender.
We hope policymakers will use the BSWI as a guide to understand where states stand, and what they can do to improve the lives of residents. Improving labor laws DOES have an impact on poverty, food scarcity, and infant mortality.
___________________________________
Explore the Best States to Work Index through the interactive map.
*We use “state” to refer to a state, district, or territory.